
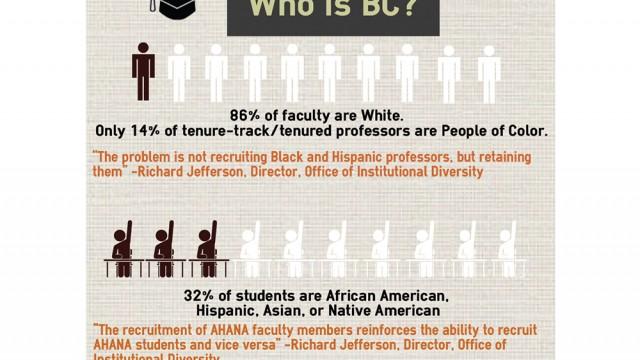
At Boston College, 86 percent of faculty are white, while 14 percent of tenure-track or tenured professors are of AHANA distinction. On the other end of the lecture hall, 32 percent of students are African American, Hispanic, Asian, or Native American, according to infographics posted around campus by three graduate students in the Lynch School of Education (LSOE).
The infographics were created in response to a letter written in March by Dean of Students Thomas Mogan and Ines Maturana Sendoya, director of the Thea Bowman AHANA and Intercultural Center, that universally condemned racism in American universities following racist chants at the University of Oklahoma and several nationwide incidents of police brutality. The students received permission from the LSOE dean to post the fliers.
By posting the infographics, the students—Shaun Glaze, GSLOE ’16, Chad Olle, GSLOE ’17, and Sriya Bhattacharyya, GLSOE ’16—hope to raise awareness and solutions regarding issues on racism on campus.
“We saw the letter that BC wrote responding to everything that’s been going on, and we kind of had mixed reactions to it,” Bhattacharyya said. “We felt happy that BC responded in some way but also felt like the letter made a whole lot of contradictory statements. And just given the amount of national media attention to this issue, we thought it was important to talk about it on this campus.”
Glaze saw irony in the fact that in the letter, BC promoted a remembrance for the March at Selma, but the students who chose to protest on campus received a punishment. Similarly, the University encourages students to go to the BCPD for issues related to racism, she said.
“At least for me, one of the big issues isn’t so much around race as it is around racism and oppression, and how the University responds to free speech and other related actions and protests,” Glaze said.
Glaze explained that after the letter came out, they were trying to find a good way to respond to it, so they decided to create the infographic to promote dialogue.
Olle said that the three of them are in a class called Critical Race Theory. They were able, then, to use this project to dig deeper into these issues and be a little more critical.
“Something came from the University and from the leaders of the University, and we thought that was important,” he said. “But we also thought it was important that the University was locating racism and responses to racism in individuals, and not taking responsibility for the role that BC plays in perpetuating this culture where it’s a little too palatable to engage in some of these racist behaviors.”
Glaze, Olle, and Bhattacharyya believe now would be an ideal time for BC to take leadership among American universities by admitting that racism does exist on campus. In overcoming this shame, the University would then be open to making real changes, they said.
The trio plans to release a second infographic by the end of the week, which will show ways in which each member of the BC community can get involved in eradicating racism.
One of the trio’s ideas is to have the faculty be evaluated on their integration of these issues into their courses. They believe this would then motivate the faculty and students to have these conversations in a classroom setting.
Bhattacharyya explained that they all went downtown to some of the protests a few months ago. Some of those protesters, she explained, were holding up mirrors. They held them up in front of cops and in front of the statehouse.
“In some ways I think our first infograph is like holding up a mirror to BC not to talk about these things, but to examine ourselves and how we perpetuate these problems,” she said.
Featured Image Courtesy of Glaze, Olle, and Bhattacharyya


sara3578 • May 2, 2015 at 4:20 pm
This is the full infographic: https://www.facebook.com/838448386220697/photos/a.838454812886721.1073741825.838448386220697/838454819553387/
And you can find out more information @ https://www.facebook.com/pages/Boston-College-Racism/838448386220697
Jeremy Moses • Apr 30, 2015 at 9:50 am
In the 1970’s (when college professors would have been in college themselves) Boston was 16% AA. Now the older, tenured staff at the college is 14% AA. Those numbers are almost the same.
The current racial demographics of Boston is about 24% AA. The current student demographics are similar. There is no racial bias. It seems to me the representation of race in the staff and student population is appropriate for the racial demographics of their times.